26 Vision II: From Visual Fields to Cortical Maps
The optic chiasm, visual thalamus, primary visual cortex, and interacting cortical pathways
Vision I ended where retinal ganglion-cell axons converge to form the optic nerve. By that point, the retina had already transformed the optical image. Photoreceptors had converted light into graded voltage changes; bipolar circuits had separated increments from decrements; horizontal and amacrine circuits had made each signal depend on spatial context; comparisons among cone classes had created early chromatic channels; and several ganglion-cell populations had encoded partly overlapping descriptions of the same region of visual space.
The organization was still by eye. The left optic nerve carried the output of the left retina, and the right optic nerve carried the output of the right retina. That arrangement is useful at the front of the system, but it is not the organization required by the cerebral cortex. Each eye sees most of both sides of visual space. To compare the two retinal images and to coordinate vision with action, the brain reorganizes the signals by visual hemifield: the left cerebral hemisphere receives the right half of the visual world, and the right hemisphere receives the left half.
The partial crossing at the optic chiasm performs that reorganization. From there, the principal pathway for detailed visual analysis passes through the lateral geniculate nucleus of the thalamus and the optic radiations to primary visual cortex, or V1. Retinotopy is preserved across these stages: neighboring locations in the visual field remain represented by neighboring neurons. What changes is the code. The LGN preserves eye of origin and major retinal-channel relationships. V1 selectively recombines those signals to represent orientation, binocular disparity, chromatic boundaries, and other spatial relationships. Later visual areas retain multiple maps while placing different weights on motion, depth, surfaces, form, and information needed for recognition or action.
The chapter therefore follows one organizing principle:
The map is preserved while the code changes.
A cortical map is not a picture projected onto the brain. It is an orderly relationship between locations in the visual field and locations in neural tissue. The neurons occupying that map do not all report the same property. At successive stages, the same mapped region of space is described through increasingly varied receptive fields and increasingly extensive interactions.
26.1 From retinal output to visual-field coordinates
The bookkeeping begins with a distinction among four things that are easy to collapse in ordinary speech:
- an eye, which contains one retina;
- a retinal location, described as nasal or temporal and superior or inferior;
- a visual-field location, described relative to fixation; and
- a cerebral hemisphere, which receives principally the opposite visual hemifield.
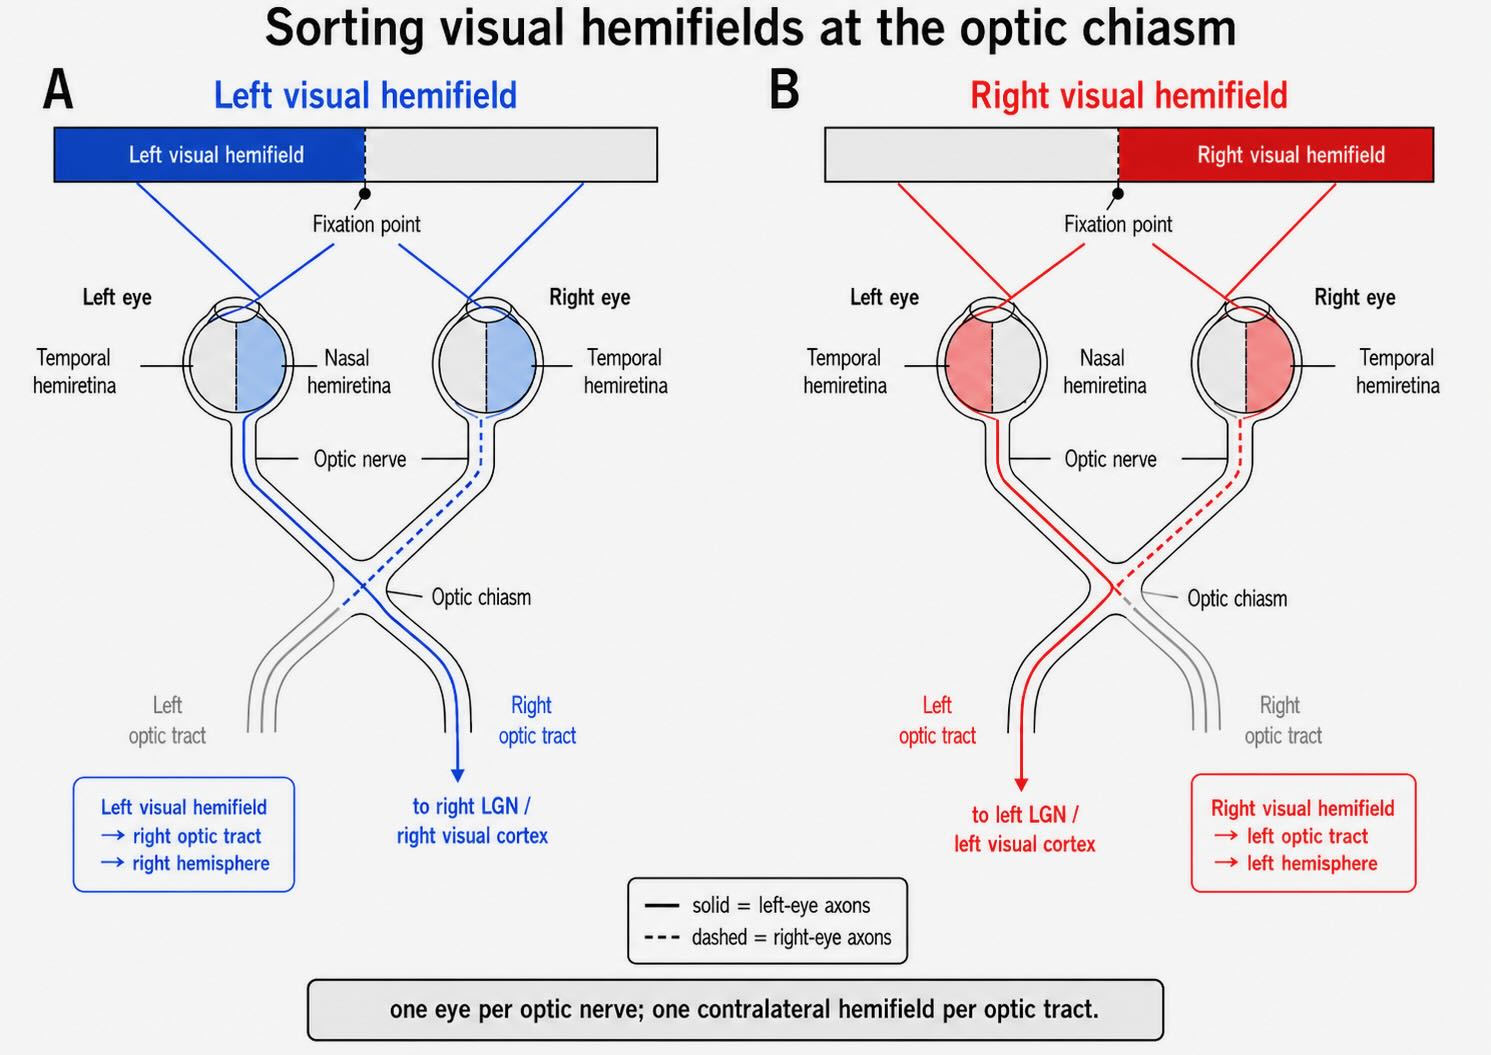
The visual field is the region of space visible while the eyes remain directed at one fixation point. A vertical line through fixation divides it into left and right hemifields. A horizontal line divides it into upper and lower fields. Because the optics reverse the image, the right visual field falls on the left half of each retina, the left visual field falls on the right half, the upper field falls on inferior retina, and the lower field falls on superior retina.
The terms nasal and temporal refer to retinal anatomy, not to visual space. The nasal hemiretina lies toward the nose; the temporal hemiretina lies toward the temple. Thus, the same visual hemifield reaches different anatomical halves in the two eyes. Light from the right visual field falls on the temporal retina of the left eye and the nasal retina of the right eye. Light from the left visual field falls on the nasal retina of the left eye and the temporal retina of the right eye.
That relation is easier to retain when one example is traced all the way through the pathway.
26.2 From two optic nerves to two visual hemifields
26.2.1 Partial crossing at the optic chiasm
Ganglion-cell axons from each eye leave through the optic disc and travel in the corresponding optic nerve. At the optic chiasm, axons from the nasal hemiretina cross to the opposite side. Axons from the temporal hemiretina remain uncrossed. The fibers leaving the chiasm form the optic tracts.
Consider the right visual field. It projects onto the temporal retina of the left eye and the nasal retina of the right eye. The left temporal-retinal axons remain on the left. The right nasal-retinal axons cross to the left. Both sets therefore enter the left optic tract, carrying two views of the right visual hemifield toward the left LGN and left visual cortex.
The complementary operation sends the left visual field into the right optic tract. This yields the most useful sentence in the early pathway:
Each optic nerve carries signals from one eye; each optic tract carries signals about the opposite visual hemifield.
The statement is approximate because the monocular crescent at the far temporal edge of each visual field is seen by only one eye, and the exact distribution of crossing fibers near the vertical meridian is anatomically intricate. For the overlapping binocular field, however, the rule captures the essential transformation.
The crossing fibers are not distributed randomly through the primate chiasm. Tracer studies show that decussating axons occupy a prominent central region through much of its anterior and middle extent [@HortonEtAl2023]. That organization helps explain why a mass expanding upward from the pituitary region can preferentially damage crossing nasal-retinal fibers.
26.2.2 Lesions reveal the pathway’s geometry
Damage at successive points produces different visual-field patterns because the representation changes from eye to hemifield at the chiasm.
A lesion of one optic nerve interrupts all ganglion-cell output from one eye. The resulting loss is monocular: the affected eye cannot provide vision, whereas the other eye can still represent most of visual space.
A lesion centered on the optic chiasm preferentially interrupts crossing axons from the two nasal hemiretinas. Nasal retina represents the temporal side of each eye’s visual field, so the characteristic deficit is loss of both temporal hemifields, a bitemporal hemianopia. The two lost regions are not adjacent in the external world when the eyes are considered separately, but they are carried by axons that meet in the chiasm.
A lesion of one optic tract, LGN, optic radiation, or visual cortex occurs after information from the two eyes has been organized by hemifield. It therefore produces a homonymous deficit: corresponding parts of the same visual hemifield are lost in both eyes. A left optic-tract lesion, for example, produces a right homonymous hemianopia.
These clinical patterns are more than diagnostic vocabulary. They expose the pathway’s coordinate system. Monocular loss indicates damage before the chiasm. Bitemporal loss points toward crossing fibers within the chiasm. Homonymous loss indicates damage after the chiasm, where the unit of organization is no longer one eye but one side of visual space.
A stimulus appears in the upper-left visual quadrant while both eyes fixate the center. Which retinal regions receive it, which fibers cross, and where does it reach cortex?
The upper field projects to the inferior retina. The left visual field projects to the nasal retina of the left eye and the temporal retina of the right eye. Axons from the left nasal retina cross at the chiasm; axons from the right temporal retina remain uncrossed. Both enter the right optic tract, continue principally to the right LGN, and reach right V1. Because the stimulus is in the upper field, its cortical representation lies principally on the lower bank of the calcarine sulcus.
26.3 One optic tract, several visual targets
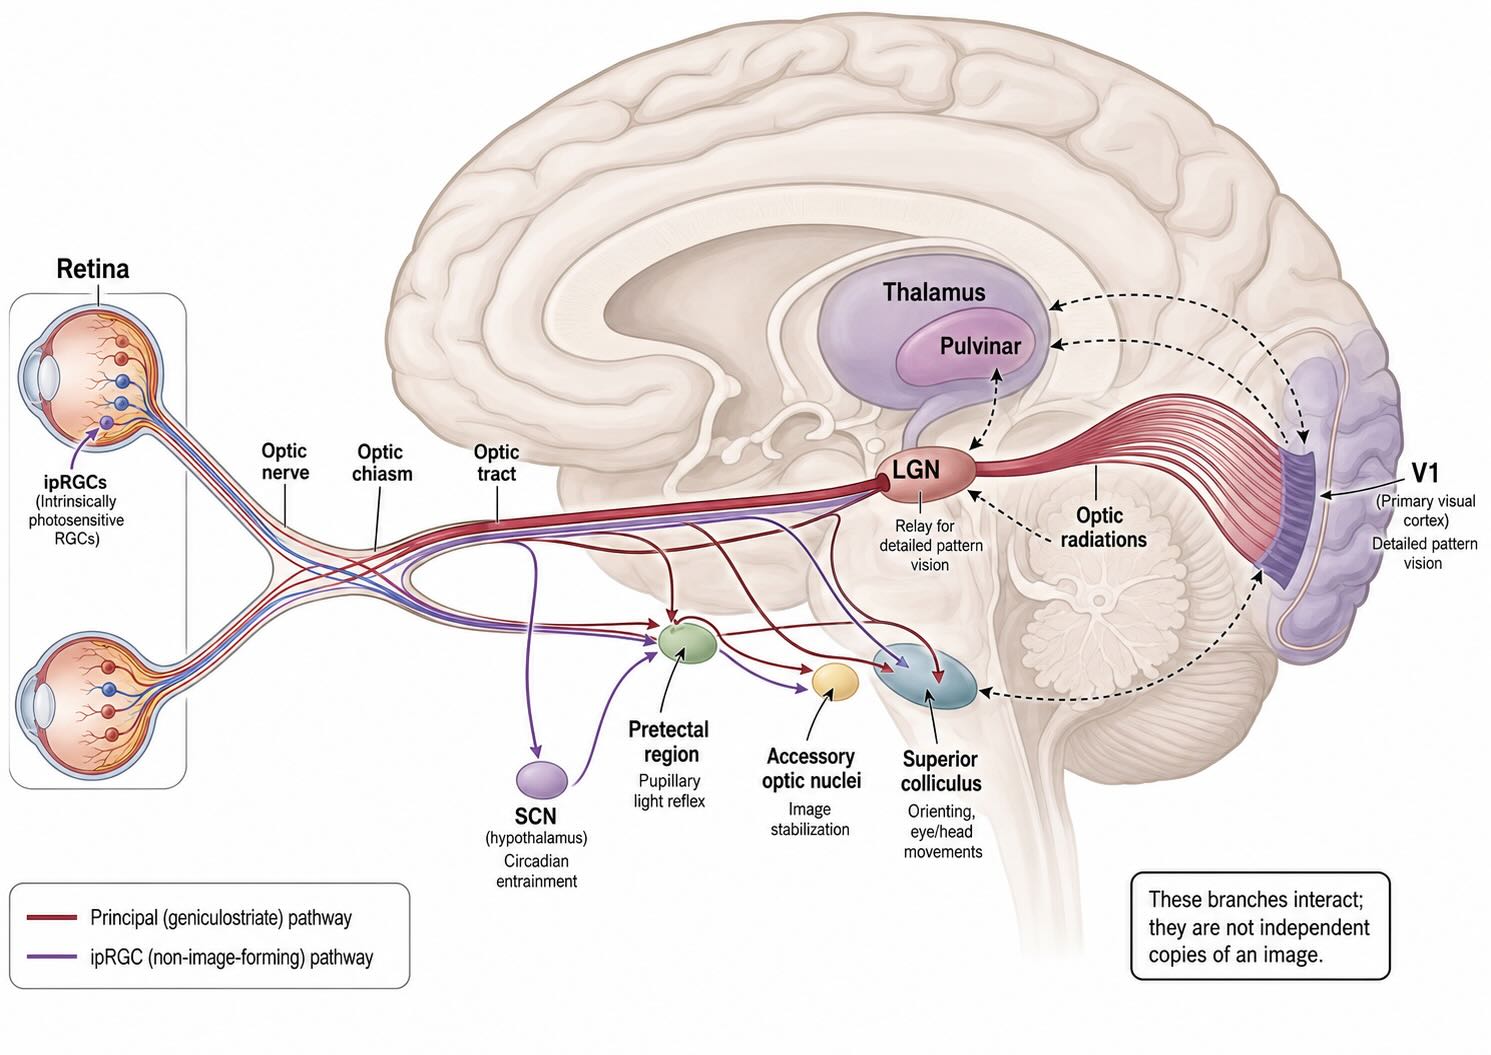
The geniculostriate pathway—from retina through LGN to V1—is the principal route for the detailed pattern vision emphasized in this chapter. It is not the only destination of retinal ganglion-cell axons. Different ganglion-cell populations distribute visual information among several subcortical systems.
The largest projection in primates terminates in the LGN, whose relay neurons project to primary visual cortex. Other axons reach the pretectal region, which participates in the pupillary light reflex; the superior colliculus, which contributes to orienting, target selection, and the control of eye and head movements; hypothalamic targets including the suprachiasmatic nucleus, which align biological time with the light–dark cycle; and the accessory optic system, which helps stabilize the retinal image during self-motion. The intrinsically photosensitive retinal ganglion cells introduced in Vision I contribute strongly to several irradiance-sensitive targets but also project to the primate LGN [@DaceyEtAl2005].
This branching should not be drawn as though the retina sends independent copies of an image into sealed pathways. The superior colliculus, pulvinar, LGN, visual cortex, and oculomotor structures interact extensively. Even the source of ordinary visual drive to the primate superior colliculus is less straightforward than the familiar direct retina-to-colliculus arrow suggests. A recent macaque preprint found that reversible LGN inactivation nearly abolished visually evoked superior-colliculus spiking while sparing saccade-related bursts; V1 inactivation also reduced the visual responses [@KatzEtAl2026]. The direct retinal projection is anatomically real, but its normal functional contribution cannot simply be inferred from the existence of the axons.
Pathways can also change after injury. In marmosets with long-standing V1 lesions, LGN projections to area MT were reorganized, with new contributions arising outside their usual koniocellular source [@AtapourEtAl2022]. This plasticity matters when residual visual abilities after cortical damage are interpreted. A pathway supporting behavior months or years after a lesion may not operate exactly as it did in the intact system.
For the present chapter, the main route remains:
retina → optic nerve → optic chiasm → optic tract → LGN → optic radiations → V1
The branches are retained because vision serves more than visual recognition. Light regulates biological time and pupil size; visual events redirect the eyes and head; image motion is used to stabilize gaze; and cortical vision is embedded in these control systems rather than isolated from them.
26.4 The LGN: a layered, recurrent visual thalamus
The lateral geniculate nucleus is a paired thalamic structure named for its bent or knee-like shape. It is commonly called a visual relay, and the term is appropriate if it means that retinal ganglion cells drive thalamic neurons whose axons project onward to cortex. It becomes misleading when relay is taken to mean passive repetition. The LGN preserves several retinal relationships, transforms the timing and gain of its output, and operates within recurrent circuits involving cortex, the thalamic reticular nucleus, local inhibitory neurons, and brainstem systems related to behavioral state.
26.4.1 Major magnocellular, parvocellular, and koniocellular relationships
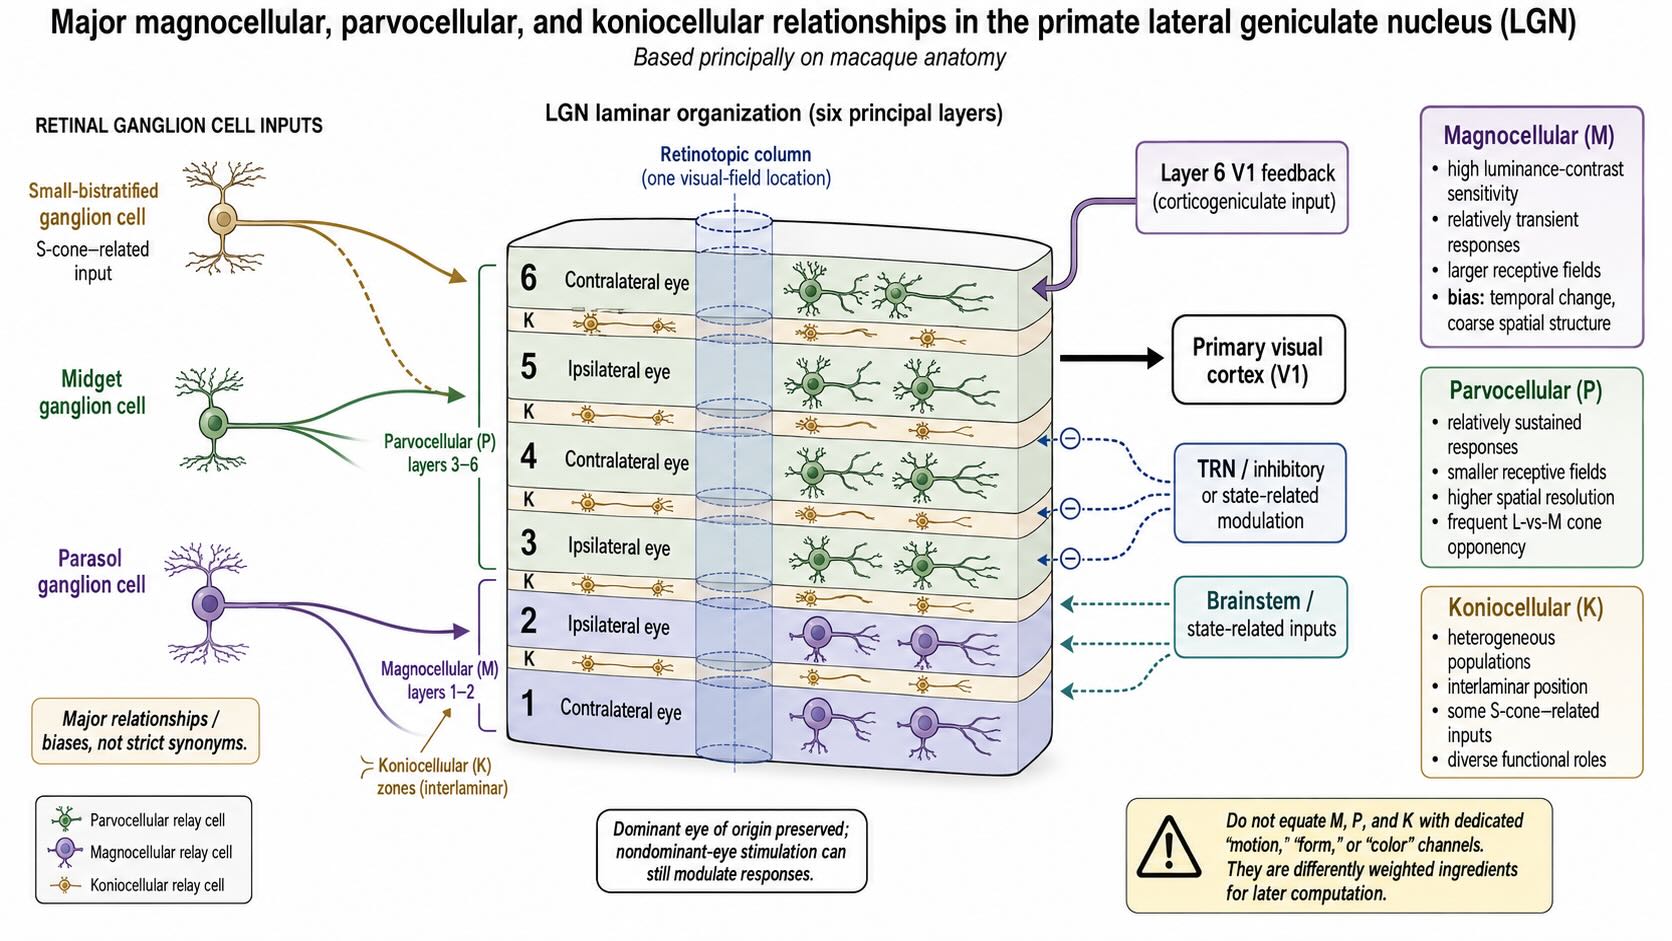
In the familiar macaque arrangement, the LGN contains six principal layers. Layers 1 and 2 are magnocellular, containing relatively large relay neurons. Layers 3 through 6 are parvocellular, containing smaller relay neurons. Koniocellular neurons occupy interlaminar and related zones between the principal layers. Human LGN has the same broad M, P, and K organization, although its folding and subdivisions should not be imagined as a perfect copy of the standard macaque diagram.
The divisions retain strong relationships with the retinal populations introduced in Vision I:
- Parasol ganglion cells provide a major input to magnocellular LGN neurons.
- Midget ganglion cells provide a major input to parvocellular LGN neurons.
- Small-bistratified cells provide one important S-cone-related input to koniocellular circuitry.
The retinal and thalamic names are not synonyms. Multiple retinal cell types contribute to the LGN, koniocellular circuitry is heterogeneous, and functional signals become increasingly recombined beyond the main geniculate input layers. The useful distinction is one of bias, not three dedicated feature cables.
Magnocellular neurons tend to have larger receptive fields, high sensitivity to luminance contrast, relatively rapid and transient responses, and little conventional chromatic opponency. Their output is well suited to representing rapid temporal changes and coarse spatial structure. Parvocellular neurons tend to have smaller receptive fields, more sustained responses, higher spatial resolution, and, in many cells, L-versus-M cone-opponent organization. Koniocellular neurons are diverse. S-cone-related responses are prominent in some populations, but the K system cannot be reduced to a blue–yellow channel.
Nor should magnocellular be translated directly as motion, parvocellular as form, and koniocellular as color. Direction and speed selectivity are substantially constructed in cortical circuits. Fine form vision draws on more than P input, and cortical color processing combines signals from several geniculate sources. The LGN divisions provide differently weighted ingredients for later computation.
26.4.2 Eye-specific layers and early binocular interaction
Each principal LGN layer receives dominant retinal input from one eye. In the conventional macaque numbering:
- layers 1, 4, and 6 receive the contralateral eye;
- layers 2, 3, and 5 receive the ipsilateral eye.
The eyes therefore do not alternate in a simple one-two-one-two sequence across all six layers. In particular, layers 2 and 3 receive the same eye of origin. The layer assignments are revealed strikingly by monocular deprivation or removal, which produces eye-specific changes in the corresponding laminae [@Hendry1991].
Within a local region of LGN, neurons in the stacked layers represent approximately the same region of the contralateral visual hemifield. The layers can therefore be pictured as retinotopically aligned sheets: several related descriptions of one visual location, separated by dominant eye and by major channel relationship.
Keeping the principal retinal drive from the two eyes distinct makes later comparison possible, but it should not be explained as though the LGN were a storage rack built solely for stereopsis. Eye-specific organization also supports binocular alignment, interocular suppression, regulation of the two eyes’ contributions, and the developmental matching of corresponding inputs. Moreover, monocular layer does not mean complete physiological isolation. Stimulation through the nondominant eye can suppress or otherwise modulate responses of macaque LGN neurons, demonstrating binocular interaction before the principal cortical convergence [@DoughertyEtAl2021].
The appropriate summary is therefore:
The LGN preserves dominant eye of origin without insulating each eye from all influence by the other.
26.4.3 A relay embedded in recurrent circuitry
Only a minority of synapses onto LGN relay neurons arise directly from retinal ganglion cells. Many additional inputs come from visual cortex, the thalamic reticular nucleus, local inhibitory neurons, and brainstem systems. Counting terminals or axons, however, does not determine which input drives the relay neuron’s spikes. Retinal terminals are comparatively powerful drivers: they establish the principal receptive-field center and convey the visual signal that is relayed to cortex. Many descending and local inputs are better described as modulators that alter gain, timing, reliability, synchrony, and the mode in which the relay responds [@Sherman2005; @BriggsUsrey2011].
The corticogeniculate projection originates mainly in cortical layer 6 and is topographically organized. It returns visual information to corresponding and surrounding LGN locations, both directly and through inhibitory circuitry. Causal experiments in ferrets indicate that removing this feedback can reduce the temporal precision and spatial resolution of geniculate responses and destabilize response gain [@HasseBriggs2017]. Feedback therefore changes how retinal signals are transmitted, but its function cannot be summarized by saying that cortex sends a prediction and the LGN reports an error. That is one possible theoretical framing, not an established description of every corticogeniculate synapse.
The same caution applies to attention. Behavioral state and task can influence thalamic responses, but the magnitude matters. A recent macaque study found that spatial attention increased LGN firing and reliability only slightly—about one percent on average—with effects that were weak, inconsistent, and concentrated in a subset of neurons [@AlittoEtAl2025]. This does not make the LGN immune to behavioral context. It does argue against portraying it as a strongly attentional gate comparable with later cortical areas.
Three statements can all be true:
- Retinal ganglion cells provide the principal driving visual input to LGN relay neurons.
- Most synapses on those neurons arise from nonretinal sources.
- Cortical and inhibitory inputs can alter when and how reliably retinal signals reach cortex without replacing the retinal signal itself.
The word relay describes the direction of the main information transfer. It does not imply a wire, a photocopier, or an absence of local computation.
The LGN is therefore best understood as a retinally driven, recurrent visual thalamus. It preserves retinotopy, major channel relationships, and dominant eye of origin while regulating the temporal and contextual form in which those signals are delivered to cortex.
26.5 The optic radiations carry the map to V1
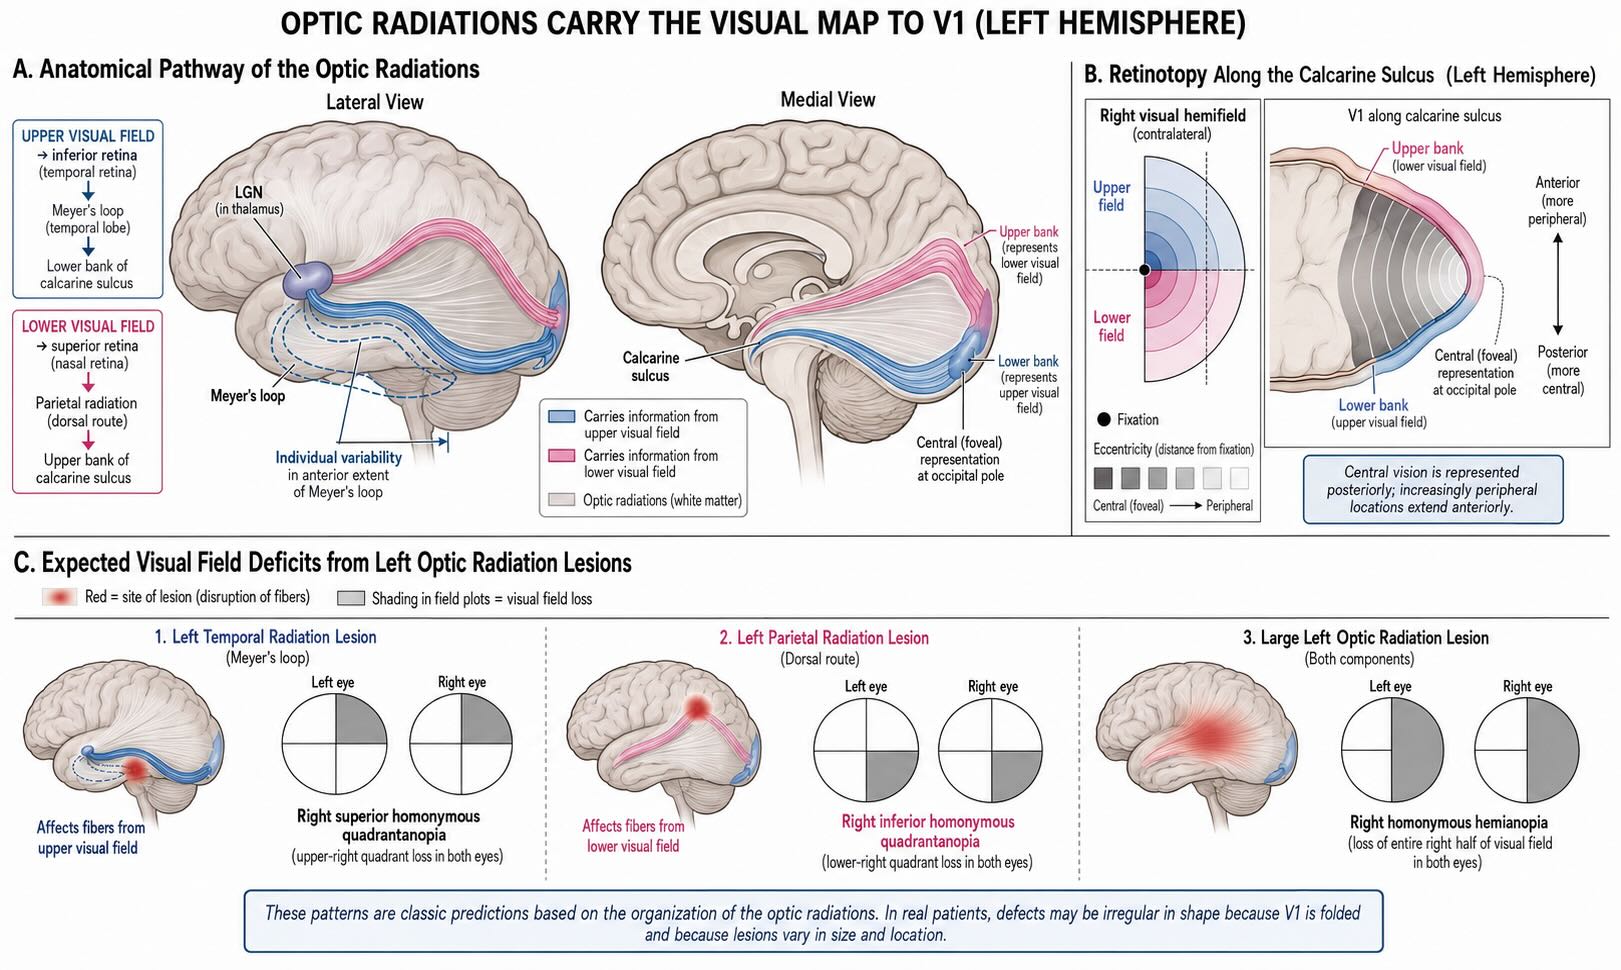
LGN relay-cell axons leave the thalamus and fan through the cerebral white matter as the optic radiations, also called the geniculocalcarine pathway. They terminate in primary visual cortex along the calcarine sulcus on the medial surface of the occipital lobe. Only the central-field representation reaches the occipital pole itself; much of V1 extends anteriorly along the upper and lower banks of the sulcus.
The radiations preserve the map of the contralateral hemifield while separating portions of it through different white-matter routes. Fibers representing the upper visual field originate from inferior retinal locations and sweep anteriorly through the temporal lobe in Meyer’s loop before turning posteriorly toward the lower bank of the calcarine sulcus. Fibers representing the lower visual field travel more directly through parietal white matter toward the upper bank.
This anatomy predicts quadrant-specific deficits. A lesion affecting the left temporal radiation, including Meyer’s loop, preferentially removes the right upper visual quadrant: a contralateral superior quadrantanopia. A left parietal-radiation lesion preferentially removes the right lower quadrant: a contralateral inferior quadrantanopia. Larger lesions can produce a complete homonymous hemianopia.
Meyer’s loop is not located at one invariant distance from the temporal pole. Diffusion-tractography and surgical studies show substantial individual variability in its anterior extent [@NilssonEtAl2007; @PowellEtAl2005]. That variation is clinically important because the amount of temporal-lobe tissue that can be removed without damaging the visual field differs among patients. The familiar mnemonic—temporal lesions affect the upper field, parietal lesions the lower—captures the map but not the precision required for surgery.
Retinotopy is also preserved along the anterior–posterior axis of calcarine cortex. Central vision is represented posteriorly, with the foveal region occupying cortex near the occipital pole. Progressively more peripheral locations extend anteriorly. The cortical surface is folded, so a small lesion can cut across complex portions of the map; real visual-field defects need not form the clean geometric blocks shown in introductory diagrams.
26.6 V1 preserves the map and changes the code
Primary visual cortex is also called V1, striate cortex, or Brodmann area 17. The term striate refers to the stripe of Gennari, a conspicuous band of myelinated fibers visible within the cortex. V1 receives the principal geniculocortical projection and provides a major source of output to the rest of visual cortex as well as feedback to the LGN.
The transition into V1 does not mark the beginning of visual computation. The retina and LGN have already transformed the signal extensively. What changes in V1 is the scale and kind of combination. Signals representing nearby retinal locations, different eyes, different response signs, and different geniculate divisions are brought into cortical circuits whose responses depend on orientation, spatial frequency, disparity, chromatic arrangement, temporal sequence, and context beyond the classical receptive field.
26.6.1 Retinotopy and cortical magnification
V1 is retinotopically organized. Neighboring locations in the visual field generally project to neighboring cortical locations, and the vertical and horizontal meridians form useful boundaries and landmarks among early visual areas. The map is contralateral and inverted: the right visual field is represented in left V1; the upper field lies principally below the calcarine sulcus; and the lower field lies principally above it.
Retinotopy preserves neighborhood, not physical scale. A degree of visual angle near fixation occupies far more V1 surface than a degree in the periphery. This cortical magnification continues the unequal sampling established in the retina. Dense foveal cone and midget circuitry supplies many independent signals, and central vision receives a correspondingly large cortical representation.
Cortical magnification should not be described as the brain assigning space according to how much each location “matters.” It reflects retinal sampling, developmental organization, cortical geometry, and functional allocation. It also varies around the visual field. In humans, V1 surface area and visual performance are generally greater along the horizontal than the vertical meridian and often greater for the lower than the upper vertical field; these asymmetries vary across individuals and are only partly explained by retinal cell density [@BensonEtAl2021].
The practical consequence is clear. A small object at fixation engages a much larger cortical population than the same object at an equal retinal size in the far periphery. The map is orderly but radically nonuniform.
26.6.2 Major geniculate inputs enter different cortical sublayers
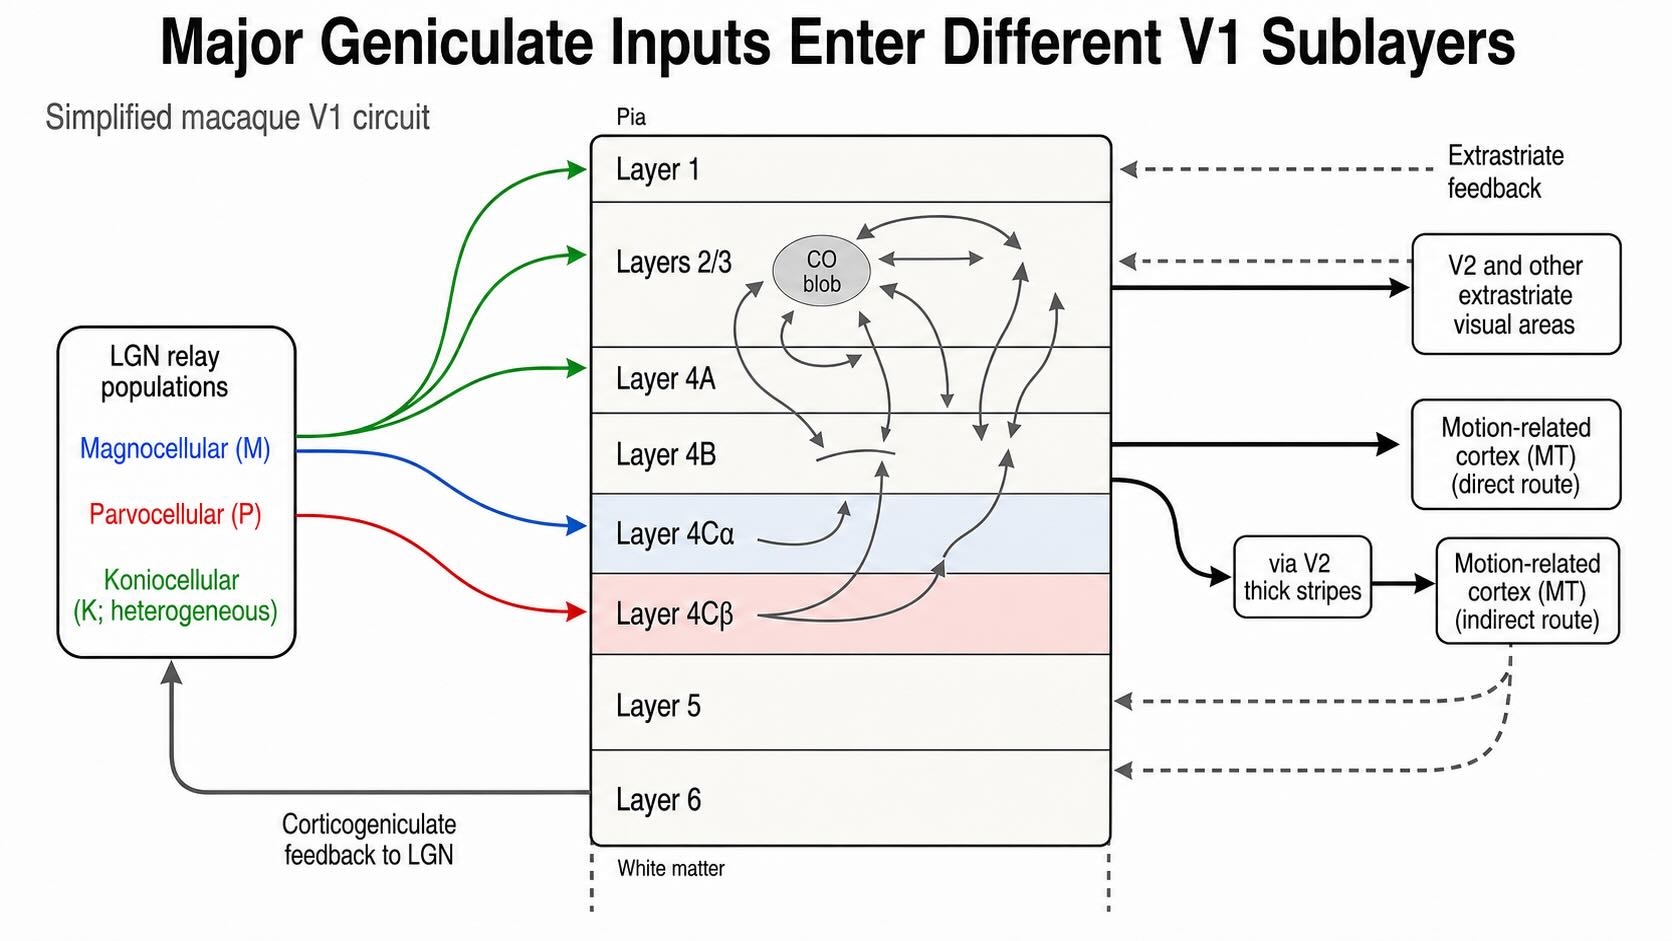
Thalamic input arrives most densely in cortical layer 4, but “LGN projects to layer 4” is only the first approximation. In macaque V1:
- magnocellular LGN axons terminate principally in layer 4Cα;
- parvocellular axons terminate principally in layer 4Cβ; and
- koniocellular pathways have more varied targets, including superficial and blob-associated territories as well as other laminar destinations.
Signals do not remain confined there. Layer 4Cα strongly influences layer 4B and superficial circuits; layer 4Cβ projects into superficial layers; and M-, P-, and K-related signals converge within intracortical networks. Layer 4B contributes direct and indirect routes toward motion-related cortex, whereas layers 2 and 3 provide extensive output to V2 and other extrastriate areas. Layer 6 sends corticogeniculate feedback to the LGN. Horizontal connections link cortical locations within V1, and feedback from later areas reaches several layers.
Physiological recordings reinforce this laminar transition. Many neurons in 4C remain strongly dominated by one eye, have relatively small receptive fields, and are less orientation-selective than cells in several output layers, although weak and strong orientation tuning occur throughout V1 [@BlasdelFitzpatrick1984; @RingachEtAl2002]. The layers are therefore not a row of sealed channel terminals followed by a single site of recombination. They are points of entry into a recurrent cortical circuit.
26.7 From local contrast to orientation
Vision I introduced retinal and geniculate receptive fields with antagonistic centers and surrounds. Such a neuron responds according to the relationship between a local center and a broader surrounding region. It may respond strongly to a small spot, a luminance boundary, an onset or offset, or another stimulus that makes center and surround differ. It should not be treated as a literal detector whose only message is “a spot is present.”
V1 constructs a different kind of spatial selectivity. Many cortical neurons respond best when a bar, edge, or grating has a particular orientation within the receptive field. A vertical boundary may produce vigorous firing, whereas the same boundary rotated toward horizontal produces progressively less. Orientation is not carried by one photoreceptor or one LGN neuron. It emerges from the spatial arrangement and interaction of multiple inputs.
Hubel and Wiesel proposed a canonical feedforward mechanism. Imagine several ON-center LGN neurons whose receptive-field centers lie along a line in visual space. A cortical neuron receiving convergent excitation from those neurons would respond weakly when only one center is stimulated, but strongly when an elongated light region activates the aligned centers together. Combining appropriately arranged ON- and OFF-center inputs can create elongated subregions that prefer a light–dark boundary with a particular orientation [@HubelWiesel1962; @HubelWiesel1968].
Paired recordings and receptive-field mapping support an important part of this proposal: geniculate neurons that connect to the same cortical simple cell tend to have receptive fields positioned so that their combined signals match the cortical cell’s elongated subregions [@ReidAlonso1995; @AlonsoEtAl2001]. The model is therefore more than a diagrammatic possibility.
It is not the entire mechanism. A typical V1 neuron receives direct or indirect input from many thalamic and cortical neurons, and orientation tuning varies substantially across cells and layers. Feedforward geometry can establish an initial bias, while recurrent excitation, suppression, synaptic nonlinearities, and feedback alter the strength and width of the final tuning [@RingachEtAl2002]. V1 responses are also influenced by stimuli outside the classical receptive field. A contour surrounding the preferred stimulus can suppress or facilitate firing depending on its orientation, position, contrast, and behavioral context. Inactivation of feedback from V2 and V3 reduces some forms of end-stopping and surround suppression, demonstrating that later areas help shape responses conventionally assigned to V1 alone [@NassiEtAl2013].
The aligned-input model should therefore be read as a construction principle:
The spatial arrangement of thalamic input helps establish orientation preference; cortical circuitry shapes the response that is measured.
This is related to, but not identical with, the center–surround comparison in the retina. Both show that selectivity depends on relationships among inputs. Retinal surrounds compare a center with neighboring space. Orientation-selective cortical neurons combine signals across an elongated arrangement and are further influenced by recurrent and contextual circuitry. The shared principle is relational coding, not one repeated circuit.
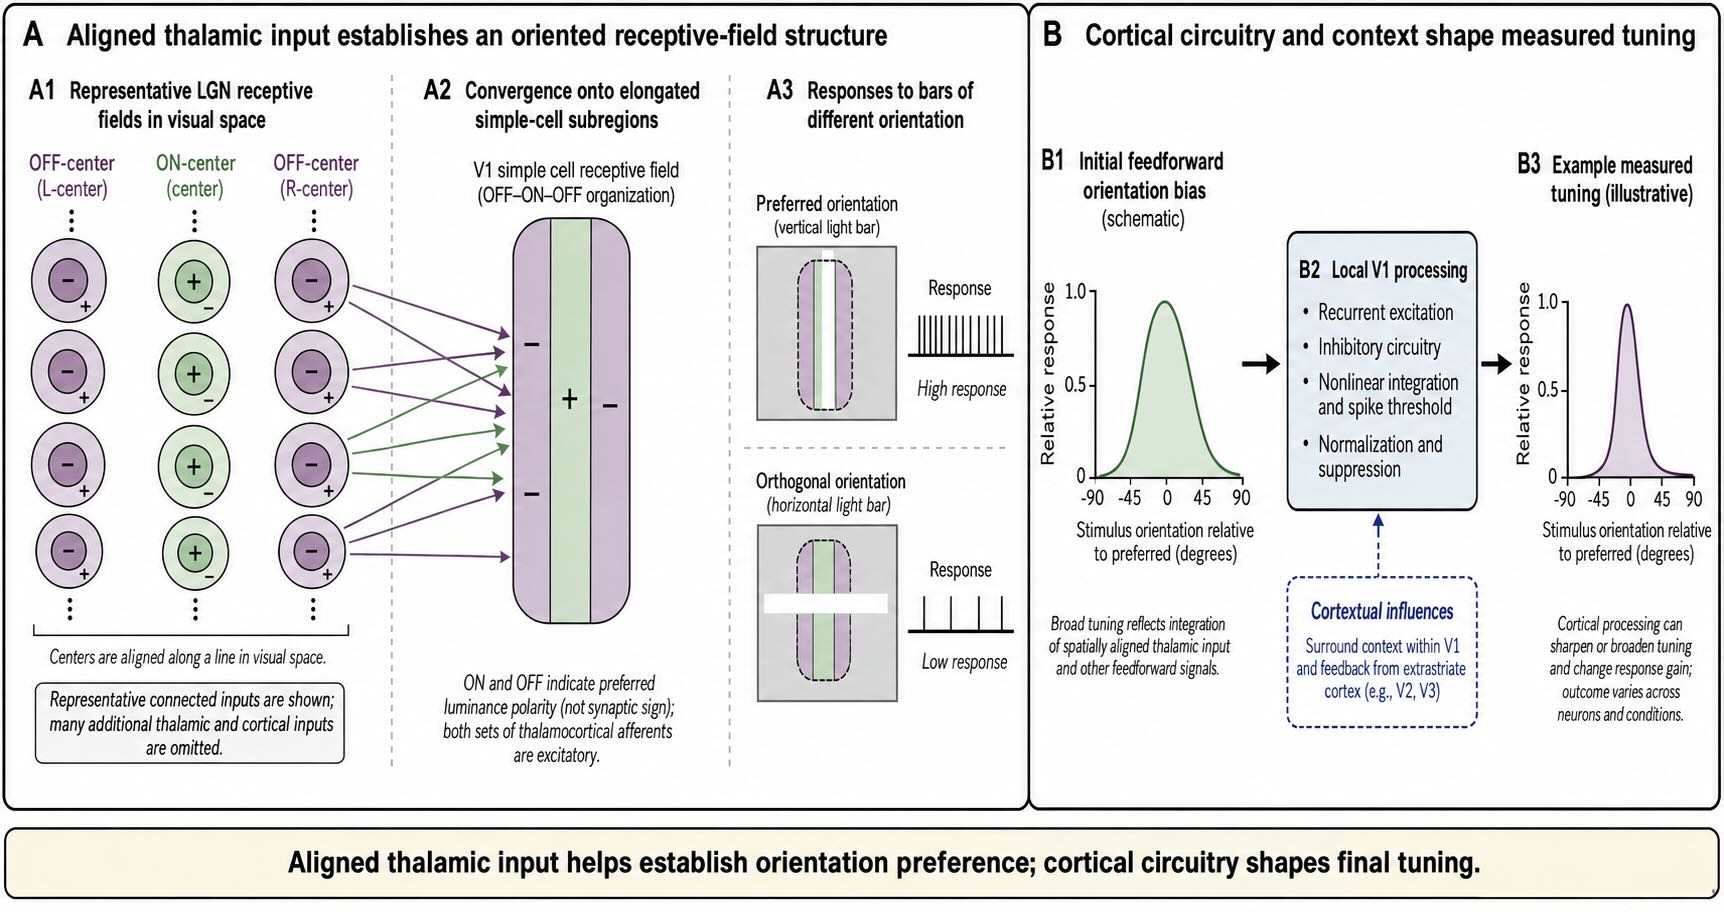
A vertical luminance boundary activates different ON- and OFF-center retinal ganglion cells along its length. Their outputs remain retinotopically organized through the LGN. What must be added in V1 for one neuron to prefer the vertical boundary over a horizontal boundary crossing the same location?
The V1 neuron must combine inputs whose receptive fields are arranged along the vertical axis, with ON and OFF contributions aligned to the light and dark sides of the boundary. The same local contrast signals arranged horizontally would not match those elongated subregions. Recurrent cortical excitation and suppression can then sharpen and contextualize the preference.
26.8 Simple, complex, and end-stopped responses
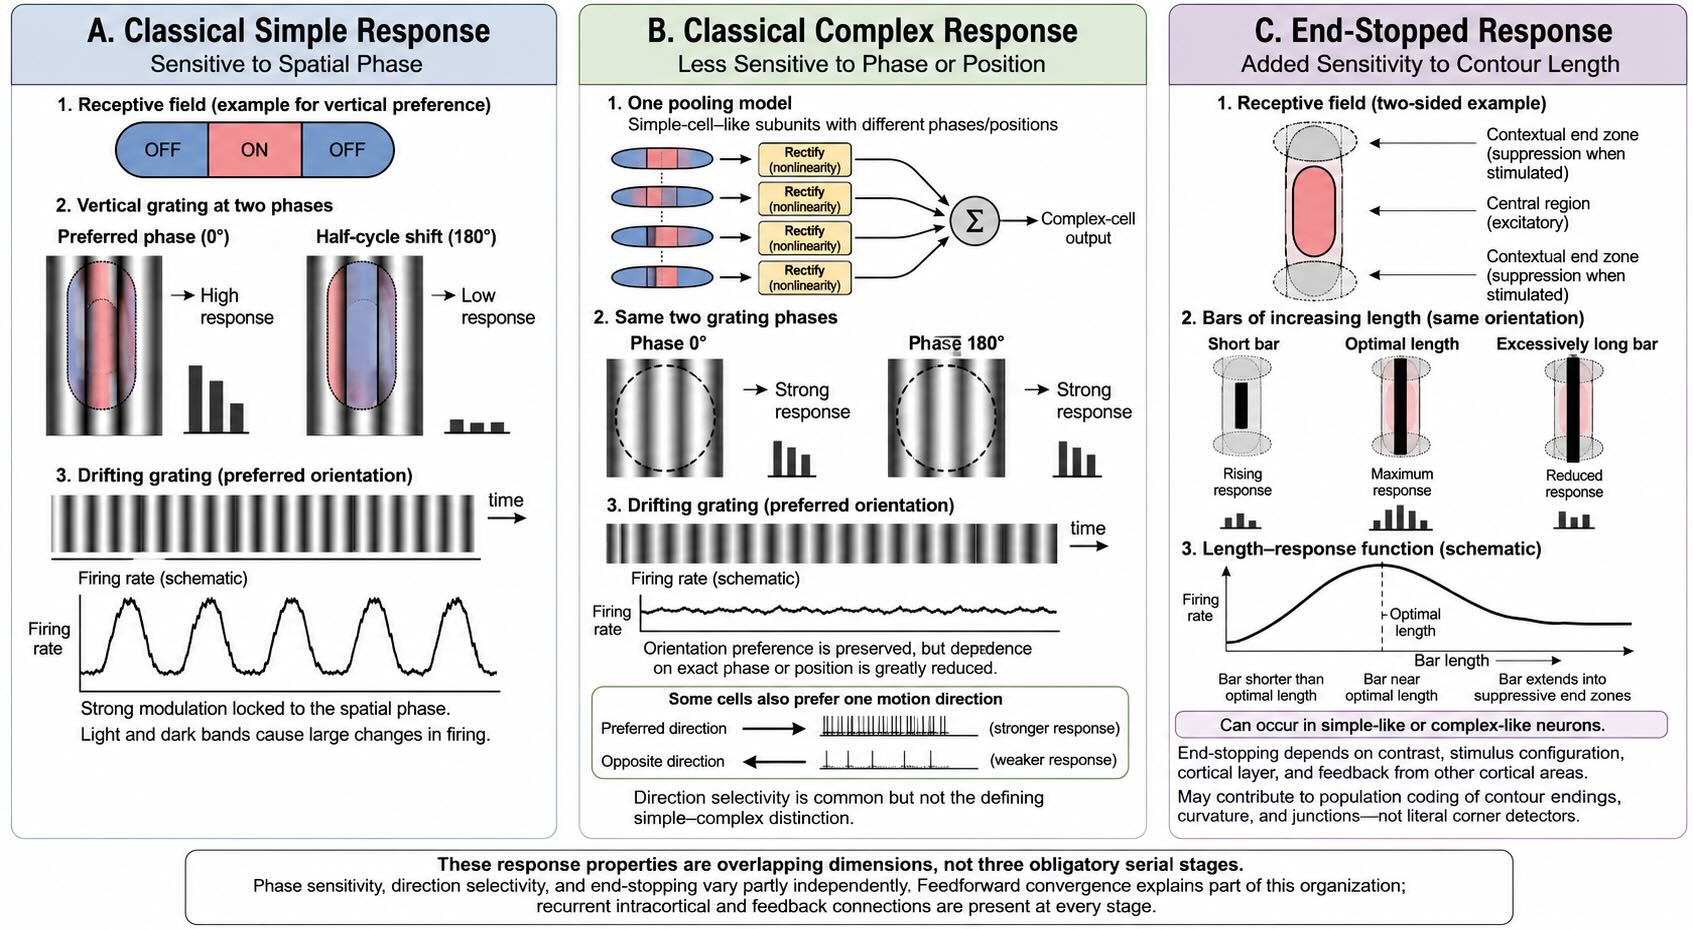
Hubel and Wiesel used receptive-field structure and response modulation to distinguish several influential classes of cortical response. The categories remain useful, but they are better treated as descriptions along partially overlapping dimensions than as three sharply separated anatomical stages.
26.8.1 Simple cells preserve spatial phase
A classical simple cell has elongated ON and OFF subregions. A light bar placed over an ON region increases firing; the same bar placed over an OFF region may suppress firing or fail to excite. A dark bar produces the complementary pattern. The cell therefore depends not only on orientation but on the precise placement of light and dark within the receptive field.
This sensitivity can be described as dependence on spatial phase. Shift a preferred grating by half a cycle, and bright and dark bands exchange positions. A simple cell whose ON and OFF subregions were well matched to the original phase can respond very differently after the shift. When a grating drifts across the field, the firing rate tends to rise and fall in step with the repeating light–dark pattern.
26.8.2 Complex cells tolerate changes in position or phase
A classical complex cell remains selective for orientation but is less dependent on exactly where the boundary falls within its receptive field. One construction model combines several simple cells that share an orientation preference but differ in the positions of their ON and OFF subregions. The pooled neuron can respond when the preferred orientation occurs across a wider range of locations or phases.
Many complex cells are also selective for direction of motion, but movement is not what defines the class. The defining contrast is reduced dependence on the exact spatial phase that strongly modulates a simple cell. The transition provides an early example of a recurring cortical operation: combine several selective inputs to gain some tolerance for a transformation while preserving another preference.
26.8.3 End-stopping adds contour extent and context
Some orientation-selective neurons respond best to a bar of limited length. Extending the bar initially increases firing as more of the excitatory region is stimulated, but extending it farther engages suppressive regions near one or both ends and reduces the response. These are end-stopped responses. The older term hypercomplex cell survives in historical accounts but implies a discrete stage that the physiology does not require.
End-stopping can contribute to the representation of contour termination, curvature, junctions, and border relationships. It is not equivalent to a labeled corner detector. Whether a cell is end-stopped can depend on contrast, stimulus configuration, cortical layer, and feedback from extrastriate cortex [@NassiEtAl2013]. A population of context-sensitive responses supplies ingredients from which later circuits can represent shape.
The classical sequence—simple cells pooled into complex cells, followed by end-stopped cells—is therefore a productive first model, not a complete wiring diagram. Cells vary continuously in the linearity of their spatial summation, strength of orientation tuning, direction selectivity, end-stopping, and contextual modulation. Feedforward convergence explains part of this organization; recurrent intracortical and feedback connections are present at every stage.
26.9 The two eyes converge: disparity and stereoscopic depth
The optic chiasm reorganizes visual information by hemifield, but the LGN preserves the dominant contribution of each eye in separate principal layers. In V1, those monocular signals begin to converge extensively. The convergence permits comparison of the two retinal images, including the small positional differences created by the separation of the eyes.
26.9.1 Corresponding retinal locations and disparity
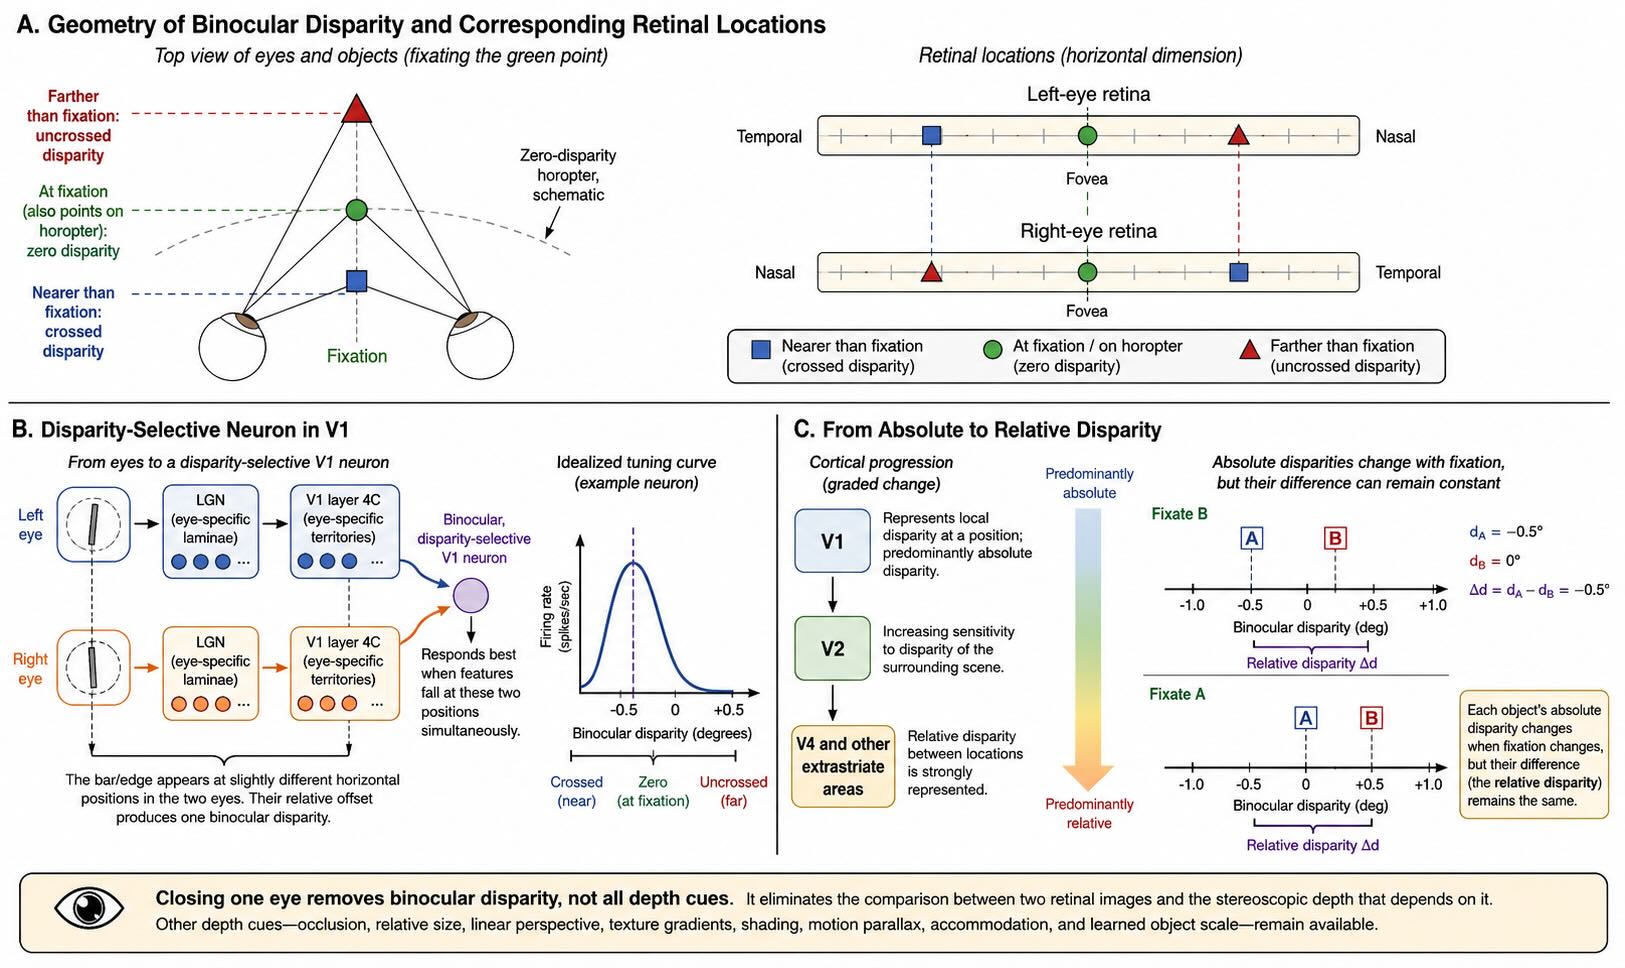
When the eyes fixate one point, that point falls on corresponding locations in the two retinas, near the two foveae. Other points lying on a particular curved surface through fixation also project to corresponding retinal locations. An object away from that surface produces a horizontal displacement between its images in the two eyes. That displacement is binocular disparity.
An object nearer than the fixation point generally produces crossed disparity. To align the two images, the eyes would need to converge more strongly, or the left-eye image would need to be matched with a right-eye image displaced in the crossed direction. An object farther than fixation produces uncrossed disparity. The sign and magnitude of disparity provide information related to depth relative to the fixation plane.
Disparity is not the same as depth, and binocular stereopsis is not the only source of depth perception. Occlusion, relative size, linear perspective, texture gradients, shading, motion parallax, accommodation, and changes in image size can all provide depth information. Closing one eye removes ordinary binocular disparity but does not flatten the visual world. It removes one especially precise cue for relative depth at near and intermediate distances.
Closing one eye eliminates the comparison between two simultaneous retinal images. It therefore removes ordinary binocular disparity and the stereoscopic depth that depends on it. It does not remove retinal size, occlusion, perspective, texture, shading, motion parallax, or learned information about object scale. Depth perception becomes less precise under some conditions, but it does not disappear.
26.9.2 Disparity-selective neurons
The main geniculate inputs remain strongly eye-specific in layer 4C. In other layers, inputs driven by the two eyes converge onto many neurons. A binocular neuron may respond well when corresponding features fall at one relative horizontal displacement and poorly when the displacement differs. Its disparity-tuning curve describes firing as a function of that interocular offset.
One way to picture the mechanism is to extend the aligned-input logic used for orientation. Suppose a cortical neuron receives an effective left-eye input at one retinotopic position and a right-eye input displaced slightly to the side. The neuron will respond most strongly when a feature occupies those two positions simultaneously. That configuration corresponds to one binocular disparity. Real disparity computation includes multiple receptive-field mechanisms and nonlinearities, but the example shows how eye-specific inputs can be combined without averaging away their difference.
Disparity-selective responses are widespread in V1. They provide signals precise enough to contribute to stereoscopic judgments, although the firing of a single neuron is variable and behavior depends on populations [@PrinceEtAl2000]. Importantly, a neuron can be equally responsive through the two eyes yet weakly disparity-selective, or dominated by one eye yet strongly selective for a particular binocular relationship. Ocular dominance measures the relative strength of stimulation through each eye; disparity selectivity measures the response to the spatial relationship between the two eyes’ images. The two properties should not be treated as the same axis [@ReadCumming2003].
26.9.3 From absolute to relative disparity
V1 neurons respond principally to absolute disparity: the disparity of a feature with respect to the current geometry of fixation. If both the feature and surrounding scene shift together in disparity, an absolute-disparity neuron may change its firing even though the relative depth between them remains constant [@CummingParker1999].
Perceived stereoscopic structure often depends more directly on relative disparity—the difference between the disparities of two features. Relative disparity supports judgments such as whether one surface lies in front of another while reducing dependence on the exact fixation point. The transformation begins beyond V1. Relative-disparity signals become more prominent in V2 and are clearly represented in V4 and other later areas [@UmedaEtAl2007].
This progression illustrates the chapter’s central theme. Retinotopic position is preserved, but the code changes from two monocular locations, to a binocular disparity at one location, to disparity relationships among locations. The later representation is not simply more “complex” in the sense of containing more features. It is expressed in a more useful reference frame for representing surfaces and objects.
26.10 Color signals are transformed in V1
Vision I ended the retinal color discussion with a warning. L-versus-M and S-versus-(L+M) signals are early physiological comparison axes, not neurons that directly announce the experienced hues red, green, blue, and yellow. V1 continues the transformation by combining cone-opponent signals with spatial organization.
26.10.1 From cone opponency to chromatic boundaries
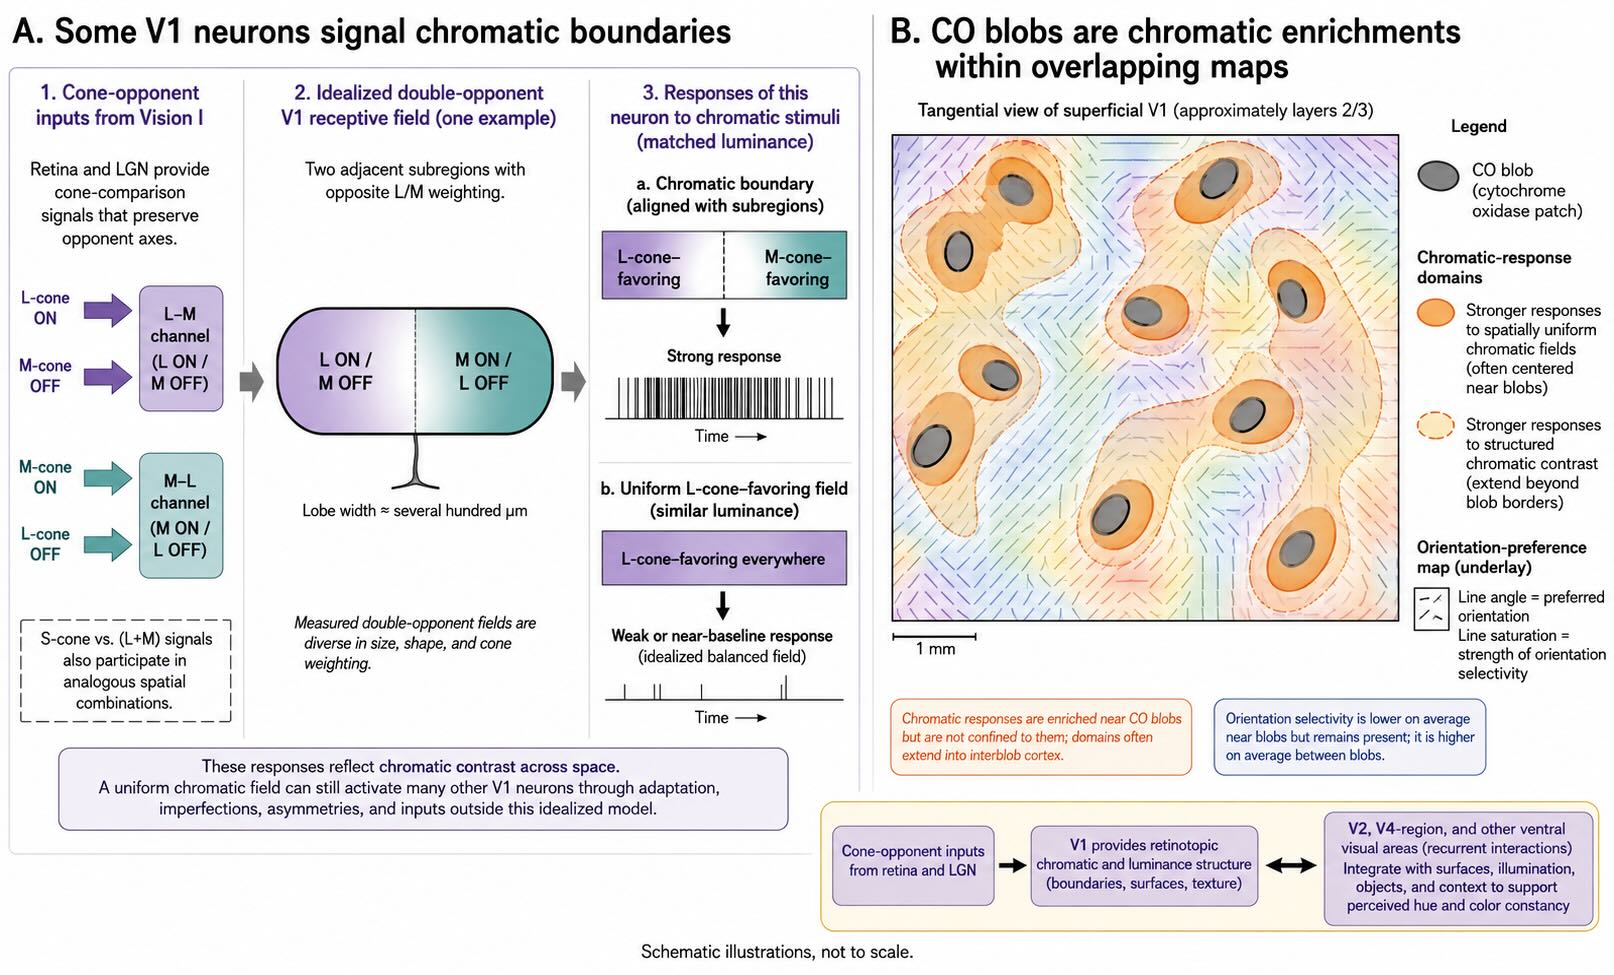
A neuron that simply compares cone classes across its entire receptive field can report a chromatic bias but provides limited information about where a colored surface begins or ends. Many V1 neurons have cone inputs arranged into spatially antagonistic regions. In an idealized double-opponent receptive field, one region might be excited by an L-cone increment and inhibited by an M-cone increment, while an adjacent region has the reverse arrangement. The cell can then respond strongly when an L-favoring region lies beside an M-favoring region—a chromatic boundary—even if the two sides have similar luminance.
The term double-opponent covers a family of spatially and chromatically structured receptive fields rather than one universal diagram. Recordings in macaque V1 reveal diverse combinations of L-, M-, and S-cone input, including cells suited to representing color contrast across space [@JohnsonEtAl2004; @DeHorwitz2022]. These responses connect the cone-comparison problem to contour and surface organization. Color is no longer represented only as the balance of cone classes at one location; it becomes part of a mapped spatial relationship.
A uniform chromatic field may still affect such neurons through adaptation, imperfect balance, receptive-field asymmetries, or responses outside the idealized model. The important teaching contrast is not that V1 discards uniform color. It is that cortical color signals include where chromatic values differ, which is essential for segmenting surfaces and boundaries.
26.10.2 Blobs are enrichments, not color modules
In superficial V1, histochemical staining for the mitochondrial enzyme cytochrome oxidase reveals regularly spaced patches called blobs. Color-responsive cortical domains align strongly with blob regions, and neurons there are, on average, less orientation-selective than neurons in surrounding interblob regions. Optical imaging in macaques shows reproducible color-related organization associated with blobs in V1 and thin-stripe regions of V2 [@LuRoe2008].
The convenient equation blob = color module is too strong. Blob neurons are not exclusively chromatic, chromatic responses occur outside blob borders, and color interacts with form, luminance, spatial frequency, and context. The blobs are best described as enrichments within overlapping maps. They reveal anatomical bias without sealing color into a separate cortical compartment.
V1 also does not complete the transformation from cone contrasts to perceived hue or color constancy. Those functions draw on recurrent interactions across V1, V2, V4-region circuitry, and other ventral occipitotemporal areas. V1 supplies retinotopic representations of chromatic and luminance structure that later circuits can combine with surfaces, illumination, objects, and context.
26.11 Several maps overlap across the V1 surface
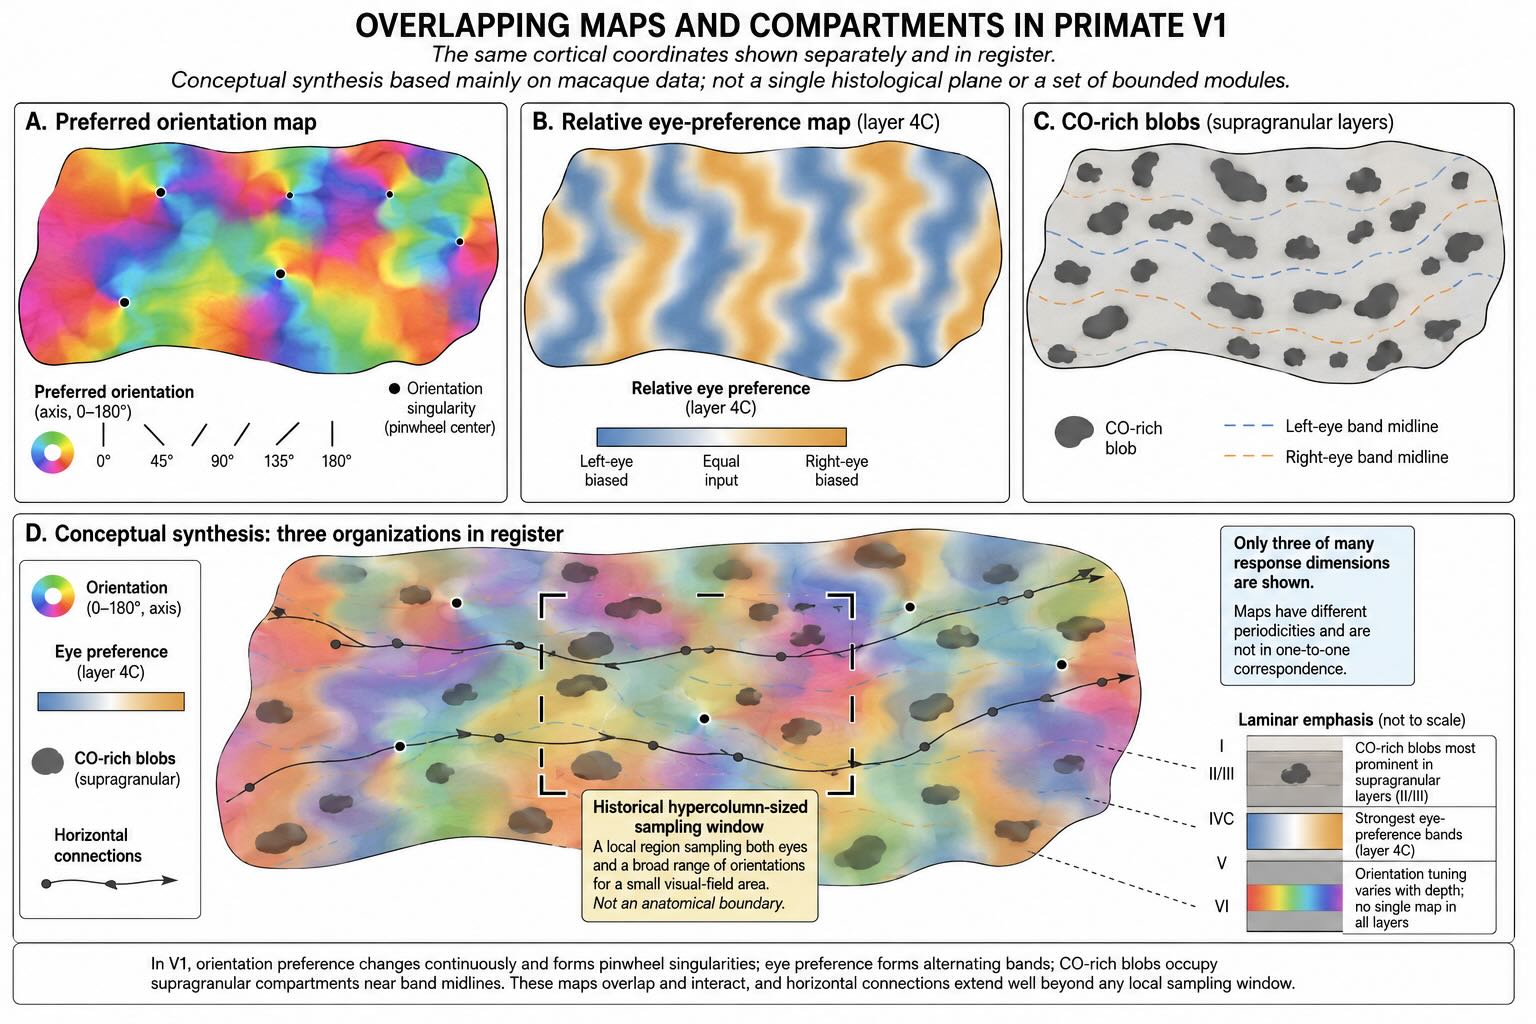
Retinotopy is the large-scale map: cortical position specifies a region of the contralateral visual field. Within that map, several response preferences vary across the cortical surface. The patterns overlap rather than occupying independent cortical sheets.
26.11.1 Orientation domains and pinwheels
Neurons encountered along a vertical penetration through V1 often share similar orientation preferences, especially outside the main geniculate input layers. Across the cortical surface, preferred orientation changes gradually through orientation domains. Around some locations, the full range of orientations is arranged around a point in a pinwheel-like pattern.
These maps do not mean that one cortical column contains a pure line detector repeated through all layers. Orientation tuning varies with depth, and nearby neurons can differ in spatial frequency, direction selectivity, disparity, color sensitivity, response phase, and contextual modulation. The map describes a local bias in one response dimension within a much larger response space.
26.11.2 Eye-preference domains
In humans and several other primates, eye preference also varies across V1. In layer 4C and related circuitry, regions dominated by one eye alternate with regions dominated by the other, producing ocular-dominance columns or bands. Their anatomical reality is well established in species with conspicuous patterns. Their special computational advantage is not.
The existence of eye-specific bands should not be confused with the existence of binocular neurons or stereopsis. Some squirrel monkeys show physiological binocular processing and stereoscopic sensitivity despite little or no visible system of ocular-dominance stripes [@LivingstoneEtAl1995]. Monocularly dominated neurons can also occur without a prominent macroscopic column pattern [@AdamsHorton2006]. The stripes may reflect developmental wiring, local connectivity, competition between eye-specific inputs, and efficient arrangement of binocular circuitry without being necessary for one uniquely identifiable faculty.
The balanced conclusion is:
The eye-preference map is real; the special computational benefit of arranging it into visible stripes remains uncertain.
26.11.3 A cautious use of the hypercolumn
Hubel and Wiesel introduced the hypercolumn as a conceptual cortical region representing a small portion of visual space while containing a broad sampling of orientation preferences and input from both eyes. Later descriptions often added color-related blobs to the same local package. The idea captures something important: for one retinotopic neighborhood, V1 contains multiple ways of describing the stimulus rather than one repeated signal.
The term becomes misleading when the hypercolumn is drawn as a sharply bounded cortical brick containing “everything about one point.” Receptive fields cover regions, not mathematical points. Their sizes vary across layers and cell types. Orientation, eye preference, color sensitivity, spatial frequency, disparity, and temporal response are represented through overlapping maps with different periodicities. Horizontal connections extend across multiple proposed hypercolumns, and feedback from later areas ignores any imagined wall.
A hypercolumn is therefore best treated as a historical sampling concept: a local expanse large enough to include a broad range of orientation and eye preferences for a small visual-field region. It is not a self-contained organ or the pixel of an internal cortical picture.
The hypercolumn helps answer one question: how can a local part of V1 sample several orientations and both eyes for roughly the same region of visual space?
It should not be used to imply that:
- cortical modules have sharp walls;
- one module contains every visual property;
- neurons inside a module communicate only with one another; or
- visual space is reconstructed as a mosaic of complete miniature pictures.
26.12 V2: biased compartments and selective recombination
Most superficial-layer output from V1 reaches V2, the second visual area, which forms a retinotopic band around V1. V2 contains another map of the contralateral visual field, but its neurons generally pool information over larger regions and show stronger sensitivity to contextual relationships, contour organization, disparity relationships, texture, and surfaces.
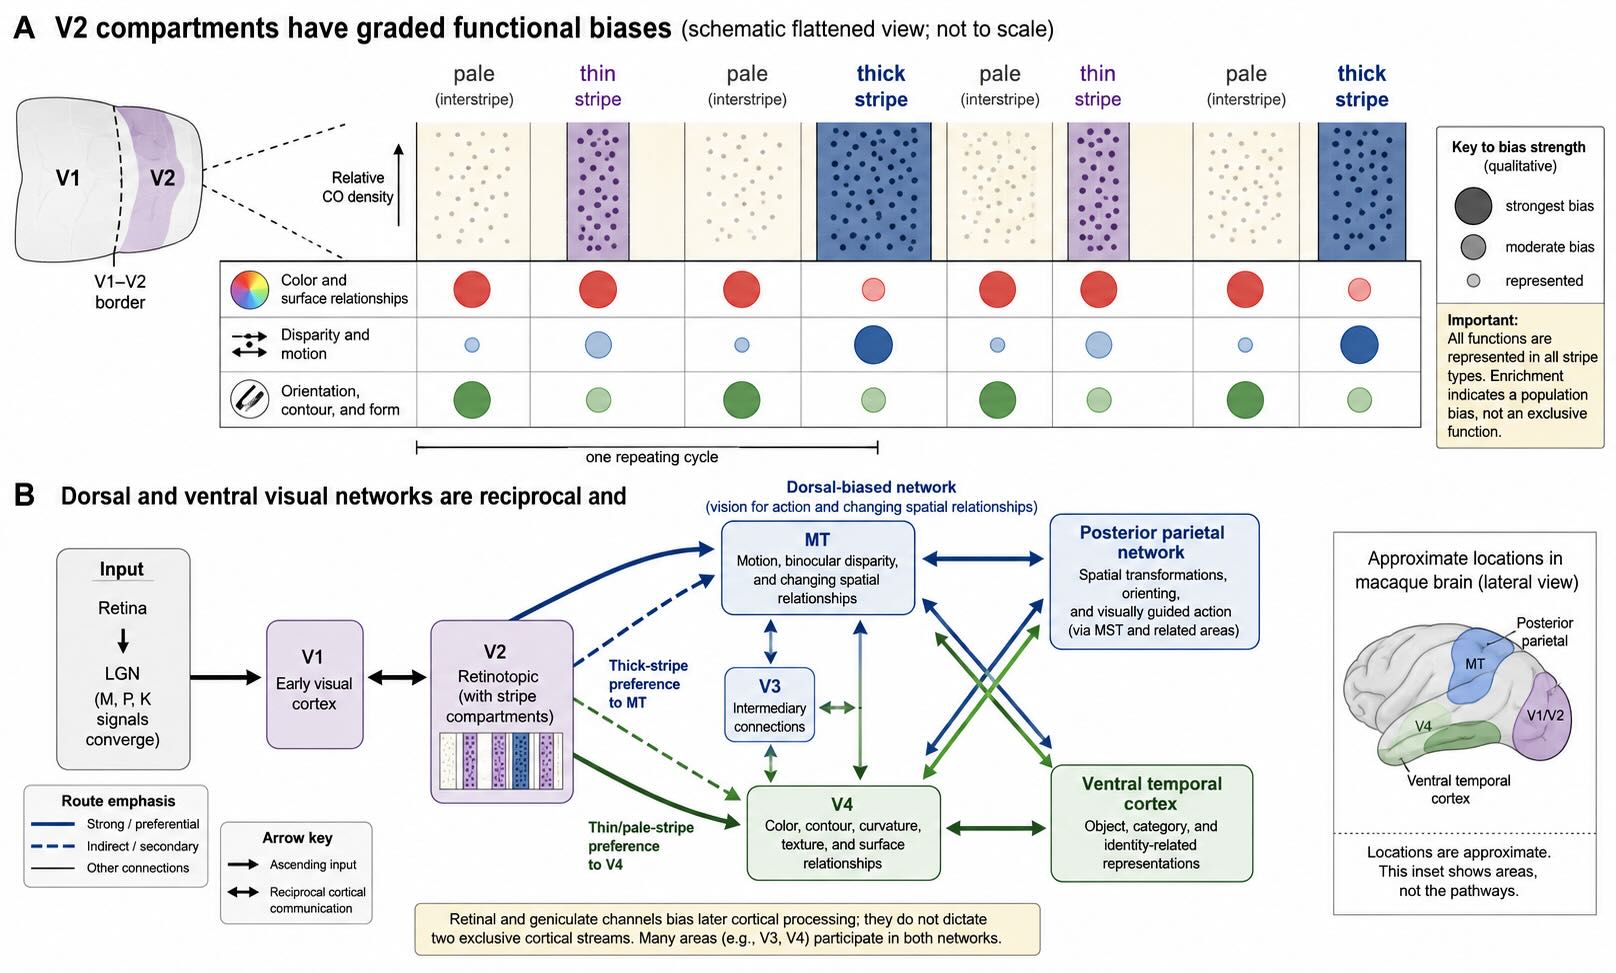
Cytochrome-oxidase staining divides V2 into repeating thin stripes, thick stripes, and intervening pale stripes, often called interstripes. Classical anatomy and physiology associate them with different biases:
- thin stripes are enriched for chromatic and surface-related responses;
- thick stripes are enriched for binocular disparity, motion-related signals, and some orientation responses; and
- pale stripes are strongly associated with orientation, contour, and form-related processing.
The words enriched and biased are essential. Orientation selectivity occurs in all stripe classes, and thick and pale stripes share several response properties. Color, luminance, form, and disparity information also cross compartment boundaries. Single-unit recordings in alert macaques show both reliable stripe-related differences and substantial overlap [@PeterhansVonDerHeydt1993; @KiperEtAl1997]. Anatomical projections likewise show preferred routes rather than impermeable channels [@DeYoeVanEssen1985].
V2 therefore does not merely preserve a retinal decomposition until some later “reassembly” stage. It continues segregation and integration at the same time. A neuron representing a contour may combine orientation signals across space. A neuron representing a surface may combine chromatic, luminance, and disparity relationships. Border-ownership and contextual responses can depend on information extending well beyond the classical receptive field. The relevant signals are recombined according to the computation being performed, not assembled into one complete picture.
The shift from V1 to V2 can again be described as a change of reference frame. V1 contains strong representations of local orientation, absolute disparity, and chromatic spatial contrast. V2 begins to represent more relational properties: which side of a contour may belong to a figure, how disparities differ across nearby regions, how contours continue through interruptions, and how local features participate in surfaces. These transformations remain retinotopic even as the effective spatial context grows.
26.13 Interacting dorsal and ventral visual networks
Beyond V2, visual cortex contains many retinotopically organized areas and additional regions in which retinotopy is coarser or interwoven with selectivity for complex forms, actions, objects, and categories [@FellemanVanEssen1991; @GlasserEtAl2016]. Two broad networks provide a useful first organization.
The ventral visual network extends from occipital cortex toward ventral temporal cortex. It places strong weight on information used to represent form, surface properties, object identity, categories, and perceptual recognition. The dorsal visual network extends toward posterior parietal cortex. It places strong weight on motion, spatial relationships, orienting, visually guided action, and transformations between retinal, head-centered, body-centered, and movement-related coordinates.
Ungerleider and Mishkin described this contrast as what versus where [@UngerleiderMishkin1982]. Goodale and Milner later argued that much of the dorsal network is better characterized as vision for action—the computations needed to reach, grasp, navigate, and adjust movement online—rather than as a general location system [@GoodaleMilner1992; @MilnerGoodale2008]. Both formulations identify genuine differences in dominant function. Neither divides visual cortex into two independent cables.
The pathways are reciprocal and extensively interconnected. Many visual areas communicate in both directions, and several areas project into more than one broad network. Retinal and geniculate channels also do not map one-to-one onto them. Magnocellular input strongly influences several rapid dorsal routes, but P- and K-related signals also reach dorsal cortex. Ventral areas receive substantial magnocellular as well as parvocellular influence. Inactivation of either M or P LGN layers alters responses in macaque V4, illustrating convergence well before the endpoint of a supposed pure pathway [@FerreraEtAl1994].
A better formulation is:
Retinal and geniculate channels bias later cortical processing; they do not dictate two exclusive cortical streams.
26.13.1 MT: motion, depth, and changing spatial relationships
The middle temporal area, or MT, is a major node of the dorsal network. In humans, a larger motion-responsive complex is often called hMT+; it includes several neighboring fields and should not be treated as a perfect one-to-one anatomical synonym for macaque MT.
Many macaque MT neurons are selective for the direction and speed of motion [@Albright1984]. Lesions of MT produce large, selective impairments in motion discrimination while leaving several static visual capacities comparatively less affected, providing strong causal evidence for its contribution [@NewsomePare1988]. MT receives rapid input through more than one route, including direct V1 projections and routes through V2 and V3. It also participates in recurrent interactions with earlier and later cortex.
MT is not only a motion detector. Many neurons are sensitive to binocular disparity, and populations can represent the three-dimensional orientation of surfaces defined by disparity gradients [@NguyenkimDeAngelis2003]. Motion, depth, eye movements, and action are naturally related: an animal must distinguish object movement from self-motion, estimate trajectories, and update targets as the eyes and body move. MT is better understood as a strongly motion-specialized node within a network for changing spatial relationships than as a cortical compartment containing motion and nothing else.
26.13.2 V4-region circuitry: color, form, and surfaces
Macaque V4 is a major node of the ventral network. Its neurons respond to combinations of color, contour, curvature, texture, shape, spatial context, and attention. Color- and orientation-related domains are organized across its cortical surface [@TanigawaEtAl2010], and recent large-scale work finds structured preferences spanning shape-like boundary information and texture-like surface information [@JiangEtAl2026].
V4 therefore should not be introduced as the brain’s color area. Color is represented in V1 and V2, and several ventral occipitotemporal regions contribute to human color perception. Functional imaging has identified multiple color-biased regions rather than one universally agreed human V4 locus [@BeauchampEtAl1999]. The nomenclature and homology between macaque V4 and particular human ventral regions remain imperfect.
The causal evidence for ventral color circuitry is nevertheless substantial. Lesions can produce cerebral disturbances of color perception, and electrical stimulation of ventral occipitotemporal cortex can evoke or disrupt color experiences in retinotopically specific ways [@ZekiEtAl1991; @AllisonEtAl1994]. The strongest conclusion is not that one area stores color, but that a distributed ventral network containing strongly color-biased regions is necessary for normal color experience while also participating in form and surface analysis.
The comparison between MT and V4 remains instructive when stated at the right level. MT places especially strong weight on motion, disparity, and changing spatial relations. V4-region circuitry places especially strong weight on color, contour, shape, texture, and surfaces. Their specializations are real, but neither area receives one pure input, performs one operation, or works in isolation.
26.14 Coda: the map is preserved while the code changes
The chapter began with two optic nerves, each carrying the output of one eye. The optic chiasm reorganized those signals so that each optic tract represented principally the opposite visual hemifield. The LGN preserved retinotopy, dominant eye of origin, and major retinal-channel relationships within a recurrent thalamic circuit. The optic radiations carried the mapped signals through temporal and parietal white matter into calcarine cortex.
V1 preserved the visual-field map but changed the code. Spatially arranged geniculate inputs contributed to orientation-selective receptive fields. Recurrent circuits added position tolerance, direction sensitivity, end-stopping, and contextual modulation. Inputs from the two eyes converged to create disparity signals. Cone-opponent inputs were reorganized into spatial representations of chromatic boundaries. Orientation domains, eye-preference bands, and color-related domains overlapped within the same retinotopic sheet.
Beyond V1, the map did not disappear and the channels did not remain sealed. V2 combined local signals into increasingly relational descriptions of contours, surfaces, and depth. Interacting dorsal and ventral networks placed different weights on information useful for action, motion, spatial transformation, form, surfaces, and recognition. MT and V4-region circuitry exemplify strong specialization without single-purpose isolation.
None of these maps constitutes a picture for an internal observer. They are distributed neural resources used to select targets, guide movements, identify objects, and support visual experience. The next chapter asks how those distributed representations contribute to the apparently coherent visual world—and what is revealed when motion, color, recognition, awareness, or visually guided action dissociates after cortical injury.
Reasonably well established
- Nasal-retinal ganglion-cell axons cross at the optic chiasm, whereas temporal-retinal axons remain uncrossed. Each optic tract therefore principally represents the contralateral visual hemifield.
- The primate LGN is retinotopically organized and contains magnocellular, parvocellular, and koniocellular circuitry. Its principal layers receive dominant input from one eye.
- Optic-radiation fibers preserve visual-field organization as they project from LGN to V1 along the calcarine sulcus.
- V1 is retinotopically organized, with disproportionate cortical representation of central vision and systematic differences around the visual field.
- Major magnocellular- and parvocellular-related inputs terminate in different V1 sublayers, followed by substantial intracortical convergence.
- Orientation-selective, simple-like, complex-like, end-stopped, binocular, disparity-sensitive, and chromatically responsive neurons are well-established properties of V1.
- Binocular-disparity computation begins in V1, while relative and surface-based depth representations become more prominent in later cortex.
- Color-responsive domains are associated with cytochrome-oxidase blobs, but color responses are not confined to them.
- V2 contains reproducible stripe-related biases together with extensive overlap and recombination.
- Dorsal and ventral cortical networks differ in their dominant computations but communicate extensively.
- MT makes a strong causal contribution to motion processing and also represents disparity and three-dimensional spatial structure. V4-region circuitry contributes to color, contour, form, texture, and surface processing.
Established in outline but more complicated than the introductory diagram
- Corticogeniculate feedback alters geniculate transmission, but its contributions to gain, precision, prediction, attention, and behavioral state are not captured by one settled function.
- Spatial attention can influence the LGN, but recent causal and recording studies indicate smaller and less consistent effects than many older summaries imply.
- Direct retinal projections to the superior colliculus are anatomically clear; how they interact with geniculostriate input during ordinary primate vision and after lesions remains under active investigation.
- Feedforward thalamic geometry contributes to orientation tuning, but the relative roles of local recurrence, suppression, synaptic nonlinearities, and extrastriate feedback vary across cells and conditions.
- Ocular-dominance stripes are conspicuous in some primates and weak or absent in others. The organization is real, but no single faculty has been shown to require the visible stripes themselves.
- The hypercolumn remains a useful sampling concept, not a sharply bounded universal cortical module.
- Blob/interblob and V2 stripe distinctions describe statistical enrichments rather than sealed functional compartments.
- M-, P-, and K-related signals influence later cortical pathways without mapping cleanly onto dorsal and ventral networks.
- The exact homologies between macaque MT/V4 and human hMT+/ventral color regions remain imperfect.
- How later visual populations support invariant recognition, coherent experience, and flexible visually guided behavior is the subject of the next chapter rather than a problem solved by locating one final “seeing area.”